Categories
erwin Expert Blog

Data Modeling in a Jargon-filled World – Internet of Things (IoT)

In the first post of this blog series, we focused on jargon related to the “volume” aspect of Big Data and its impact on data modeling and data-driven organizations. In this post, we’ll focus on “velocity,” the second of Big Data’s “three Vs.”

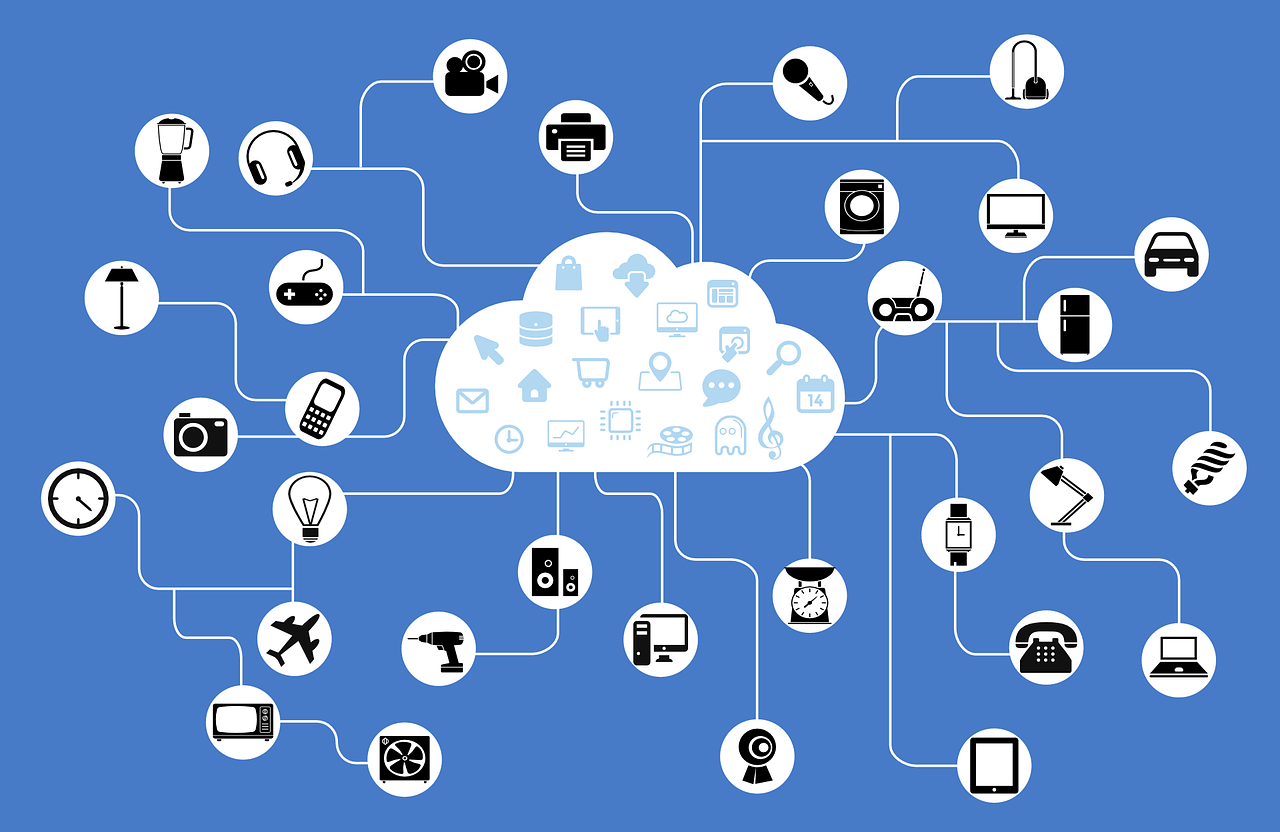
In particular, we’re going to explore the Internet of Things (IoT), the constellation of web-connected devices, vehicles, buildings and related sensors and software. It’s a great time for this discussion too, as IoT devices are proliferating at a dizzying pace in both number and variety.

Though IoT devices typically generate small “chunks” of data, they often do so at a rapid pace, hence the term “velocity.” Some of these devices generate data from multiple sensors for each time increment. For example, we recently worked with a utility that embedded sensors in each transformer in its electric network and then generated readings every 4 seconds for voltage, oil pressure and ambient temperature, among others.

While the transformer example is just one of many, we can quickly see two key issues that arise when IoT devices are generating data at high velocity. First, organizations need to be able to process this data at high speed.  Second, organizations need a strategy to manage and integrate this never-ending data stream. Even small chunks of data will accumulate into large volumes if they arrive fast enough, which is why it’s so important for businesses to have a strong data management platform.

It’s worth noting that the idea of managing readings from network-connected devices is not new. In industries like utilities, petroleum and manufacturing, organizations have used SCADA systems for years, both to receive data from instrumented devices to help control processes and to provide graphical representations and some limited reporting.

More recently, many utilities have introduced smart meters in their electricity, gas and/or water networks to make the collection of meter data easier and more efficient for a utility company, as well as to make the information more readily available to customers and other stakeholders.

For example, you may have seen an energy usage dashboard provided by your local electric utility, allowing customers to view graphs depicting their electricity consumption by month, day or hour, enabling each customer to make informed decisions about overall energy use.

Seems simple and useful, but have you stopped to think about the volume of data underlying this feature? Even if your utility only presents information on an hourly basis, if you consider that it’s helpful to see trends over time and you assume that a utility with 1.5 million customers decides to keep these individual hourly readings for 13 months for each customer, then we’re already talking about over 14 billion individual readings for this simple example (1.5 million customers x 13 months x over 30 days/month x 24 hours/day).

Now consider the earlier example I mentioned of each transformer in an electrical grid with sensors generating multiple readings every 4 seconds. You can get a sense of the cumulative volume impact of even very small chunks of data arriving at high speed.

With experts estimating the IoT will consist of almost 50 billion devices by 2020, businesses across every industry must prepare to deal with IoT data.

But I have good news because IoT data is generally very simple and easy to model. Each connected device typically sends one or more data streams with each having a value for the type of reading and the time at which it occurred. Historically, large volumes of simple sensor data like this were best stored in time-series databases like the very popular PI System from OSIsoft.

While this continues to be true for many applications, alternative architectures, such as storing the raw sensor readings in a data lake, are also being successfully implemented. Though organizations need to carefully consider the pros and cons of home-grown infrastructure versus time-tested industrial-grade solutions like the PI System.

Regardless of how raw IoT data is stored once captured, the real value of IoT for most organizations is only realized when IoT data is “contextualized,” meaning it is modeled in the context of the broader organization.

The value of modeled data eclipses that of “edge analytics” (where the value is inspected by a software program while inflight from the sensor, typically to see if it falls within an expected range, and either acted upon if required or allowed simply to pass through) or simple reporting like that in the energy usage dashboard example.

It is straightforward to represent a reading of a particular type from a particular sensor or device in a data model or process model. It starts to get interesting when we take it to the next step and incorporate entities into the data model to represent expected ranges –  both for readings under various conditions and representations of how the devices relate to one another.

If the utility in the transformer example has modeled that IoT data well, it might be able to prevent a developing problem with a transformer and also possibly identify alternate electricity paths to isolate the problem before it has an impact on network stability and customer service.

Hopefully this overview of IoT in the utility industry helps you see how your organization can incorporate high-velocity IoT data to become more data-driven and therefore more successful in achieving larger corporate objectives.

Subscribe and join us next time for Data Modeling in a Jargon-filled World – NoSQL/NewSQL.

Data-Driven Business Transformation

Categories
erwin Expert Blog

Enterprise Architecture vs. Data Architecture vs. Business Process Architecture

Despite the nomenclature, enterprise architecture, data architecture and business process architecture are very different disciplines. Despite this, organizations that combine the disciplines enjoy much greater success in data management.

Both an understanding of the differences between the three and an understanding of how the three work together, has to start with understanding the disciplines individually:

What is Enterprise Architecture?

Enterprise architecture defines the structure and operation of an organization. Its desired outcome is to determine current and future objectives and translate those goals into a blueprint of IT capabilities.

A useful analogy for understanding enterprise architecture is city planning. A city planner devises the blueprint for how a city will come together, and how it will be interacted with. They need to be cognizant of regulations (zoning laws) and understand the current state of city and its infrastructure.

A good city planner means less false starts, less waste and a faster, more efficient carrying out of the project.

In this respect, a good enterprise architect is a lot like a good city planner.

What is Data Architecture?

The Data Management Body of Knowledge (DMBOK), define data architecture as  “specifications used to describe existing state, define data requirements, guide data integration, and control data assets as put forth in a data strategy.”

So data architecture involves models, policy rules or standards that govern what data is collected and how it is stored, arranged, integrated and used within an organization and its various systems. The desired outcome is enabling stakeholders to see business-critical information regardless of its source and relate to it from their unique perspectives.

There is some crossover between enterprise and data architecture. This is because data architecture is inherently an offshoot of enterprise architecture. Where enterprise architects take a holistic, enterprise-wide view in their duties, data architects tasks are much more refined, and focussed. If an enterprise architect is the city planner, then a data architect is an infrastructure specialist – think plumbers, electricians etc.

For a more in depth look into enterprise architecture vs data architecture, see: The Difference Between Data Architecture and Enterprise Architecture

What is Business Process Architecture?

Business process architecture describes an organization’s business model, strategy, goals and performance metrics.

It provides organizations with a method of representing the elements of their business and how they interact with the aim of aligning people, processes, data, technologies and applications to meet organizational objectives. With it, organizations can paint a real-world picture of how they function, including opportunities to create, improve, harmonize or eliminate processes to improve overall performance and profitability.

Enterprise, Data and Business Process Architecture in Action

A successful data-driven business combines enterprise architecture, data architecture and business process architecture. Integrating these disciplines from the ground up ensures a solid digital foundation on which to build. A strong foundation is necessary because of the amount of data businesses already have to manage. In the last two years, more data has been created than in all of humanity’s history.

And it’s still soaring. Analysts predict that by 2020, we’ll create about 1.7 megabytes of new information every second for every human being on the planet.

While it’s a lot to manage, the potential gains of becoming a data-driven enterprise are too high to ignore. Fortune 1000 companies could potentially net an additional $65 million in income with access to just 10 percent more of their data.

To effectively employ enterprise architecture, data architecture and business process architecture, it’s important to know the differences in how they operate and their desired business outcomes.Enterprise Architecture, Data Architecture and Business Process Architecture

Combining Enterprise, Data and Business Process Architecture for Better Data Management

Historically, these three disciplines have been siloed, without an inherent means of sharing information. Therefore, collaboration between the tools and relevant stakeholders has been difficult.

To truly power a data-driven business, removing these silos is paramount, so as not to limit the potential analysis your organization can carry out. Businesses that understand and adopt this approach will benefit from much better data management when it comes to the ‘3 Vs.’

They’ll be better able to cope with the massive volumes of data a data-driven business will introduce; be better equipped to handle increased velocity of data, processing data accurately and quickly in order to keep time to markets low; and be able to effectively manage data from a growing variety of different sources.

In essence, enabling collaboration between enterprise architecture, data architecture and business process architecture helps an organization manage “any data, anywhere” – or Any2. This all-encompassing view provides the potential for deeper data analysis.

However, attempting to manage all your data without all the necessary tools is like trying to read a book without all the chapters. And trying to manage data with a host of uncollaborative, disparate tools is like trying to read a story with chapters from different books. Clearly neither approach is ideal.

Unifying the disciplines as the foundation for data management provides organizations with the whole ‘data story.’

The importance of getting the whole data story should be very clear considering the aforementioned statistic – Fortune 1000 companies could potentially net an additional $65 million in income with access to just 10 percent more of their data.

Download our eBook, Solving the Enterprise Data Dilemma to learn more about data management tools, particularly enterprise architecture, data architecture and business process architecture, working in tandem.