
Reports › Create Reports Using Report Designer › Dimensional Modeling › Report on Data Lineage with Diagrams
Report on Data Lineage with Diagrams
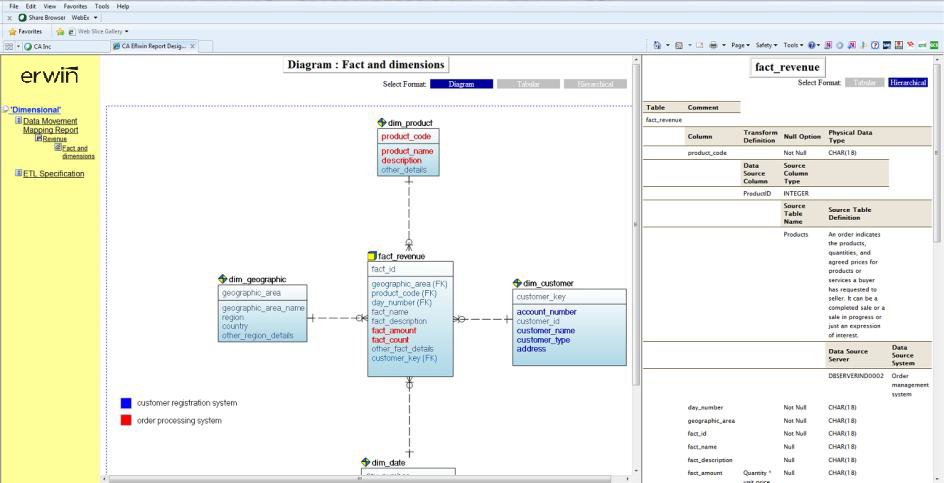
This report includes the data lineage (data source mapping) with diagrams.
Note: To generate this report, you must have a model that documents data movement sources and has the column level mappings defined.
Follow these steps:
- Open erwin® Data Modeler and open a model in which data movement sources and column level mappings are defined.
- Click Tools, Report Designer.
- Click Create New Report. The erwin Report Editor dialog opens.
- Enter the title of the report as Browse ETL Mapping.
- Enter a name for the report and select the Report Type as Logical/Physical.
- Select the Report Subject as Entity/Table.
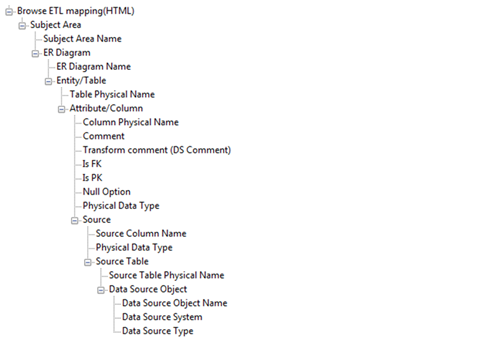
- In the Select Report Fields pane, expand Entity, Properties, and select Name, Definition.
- Expand Subject Area, Properties, and select Name.
- Expand ER Diagram, Properties, and select Name.
- Expand Members, Table/Entity, Properties, and select Table Physical Name.
- Expand Attribute/Column, Properties, and select Comment, Physical Name, Null Option, Physical Data Type, DS Comment.
- Expand Data Movement Column, Properties, and select Name, Physical Data Type.
- Expand Data Source Table/Data Movement Table, and select Name.
- Expand Data Source Object, Properties, and select Name, Data Source System, Data Source Type.
- Expand Attribute, Key Type and select Is PK, Is FK.
- Cick OK. The report template is added to erwin Report Designer.

- In erwin Report Designer, right-click the template and click Export to HTML.
The report is generated and displayed.

- Open the HTML report and verify the data mappings. Verify that the report contains diagrams and clickable entities through which you can navigate to the data source mapping information.
Click here to view a video demonstration of this report.
Copyright © 2017 erwin Inc.
All rights reserved.
 
|
|


