Create Reports Using Report Designer
Report Designer lets you create a wide variety of reports and on the current data available in your data models. If you are working in the Workgroup Edition, you can create Mart administrative reports and cross-model reports. You can create report templates for frequently used reports and you can export reports to HTML, CSV, and PDF formats. You can create report solutions and include multiple report templates.
You cannot reuse the .RTB reports that were created using Report Template Builder, because the metamodel objects are changed. You must recreate the reports in Report Designer.
Several sample (pinned) reports are included with the application and they are available in the following location:
%Installdir%\erwin\Data Modeler r9\BackupFiles\Report Solutions
Also at the following location:
- Windows 7
C:\Users\<user name>\AppData\Local\erwin\Data Modeler\9.8\Report Solutions
Note: The pinned reports are created using a Logical-Physical model. If you use the pinned reports with a Logical-only or a Physical-only model, it may result in inappropriate results.
Follow these steps:
- Click Tools, Report Designer. The erwin Report Designer window opens.
- To create a report solution, click Create new solution for reports on the toolbar.
If the current report solution is not saved already, you are prompted to save it. A new blank workspace appears.
- To create a report template, follow these steps:
- Click Create a Report on the toolbar. The Report Editor dialog appears.
- Enter a name for the report.
- Select the model type that you want to report on. Select Mart to create a report on the Mart data.
The items in the Select Report Subject pane change according to the Report Type that you select.
Note: You must have the Reports: View permission to create Mart reports.
- In the Select Report Subject pane, select the item on which you want to generate the report.
- In the Select Report Fields pane, select the fields that you want to include in the report.
- To create a report that filters specific objects and includes them in the report, use the Filter by option. This option is available only for entities, tables, attributes, columns, subject areas, and indexes.
- Click Run Report.
If you are creating a report on your Mart and you have selected an option under Filter By, the Mart Report Filter dialog opens.
- Select the specific models that you want to get the results from. Enter the specific model object name. Use wildcard characters, if necessary.
The report is generated and displayed. If you do not specify any model or entity, the generated report includes all the models. If you have used a wildcard, by default, the wildcard is applied to all the names. For example, if you type ID, the report includes Cust_ID and ID_For_Category. If the result is very large for Mart reports, the report is displayed in multiple pages (data grid). Use the navigational icons in the toolbar to view the subsequent pages.
- (Optional) Click the Clear data in data grid icon to clear the results in the grid.
- To configure report preferences, follow these steps:
- Click Edit, Preferences. The Report Designer Preferences dialog appears.
- Complete the following fields and click OK:
- Add object type as prefix for the properties 'Name' and 'Physical Name'
Prefixes the object type to only the Name and Physical Name columns. For example, you are generating a report on entities and the corresponding attribute names and data types. The column names in the report are displayed as Entity Name, Attribute Name, and Attribute Logical Data Type.
- Add object type as prefix for all other properties
Prefixes the object type to all columns.
Note: These options work only when they are selected at the time of creating a report. If these options are selected at the time of modifying an existing report, they do not work.
- Apply optimization mode if row count is more than
Specifies the number of rows at which the computer resources are optimized to display the report. If the row count in your report exceeds the number that you specify here, the report is displayed in optimization mode. In this mode, the group and sort options are not available in the result grid. If no value is entered, the row count for optimization mode is considered as equal to the total row count of a report.
- Number of top rows to display
Specifies the number of top rows that you want to display. This option displays the first few rows that match a report criteria, when the result contains more rows than the number specified here.
- To generate a report from an existing report template, select the template, right-click, and click Run.
- To modify an existing report template, select the template, right-click and then click Properties. After you finish modifying, click Run Report.
Note: When you modify an existing report template and select more properties for the existing report subject, the selections are retained. If you select a different report subject, the previous report subject and its properties are not included in the report.
- To customize the appearance of the report at the node-level, follow these steps:
- Right-click the node and click Properties. Complete the following fields:
- Name
Specifies the name of the node. By default the name of the selected object is displayed.
- HTML Style
Note: These settings apply to both HTML and PDF reports.
Font Family: Specifies the font for the selected node.
Size: Specifies the font size for the selected node.
PDF Page Breaking: Specifies that you want to display the details of each node on a new page. The node for which this option is selected and the subsequent nodes are displayed on a new page. This option is not effective when the report has only one node. When the report has multiple nodes, do not set this option on the main node. Suppose your report nodes look like the following illustration:
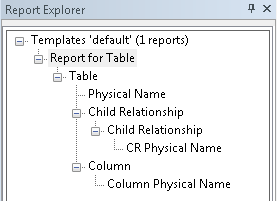
If you apply the PDF Page Breaking option to the Child Relationship (above CR Physical Name) node, the CR Physical Name and Column Physical Name nodes are displayed on a new page.
Foreground: Specifies the text color.
Background: Specifies the background color.
Template Color: Specifies that the color that is specified in the template is used.
Bold/Italic/Underline/Strikeout: Specifies the effect for the text.
Width: Specifies the width of the selected node (report column). You can specify the width for any node and it is applied when the report is exported to HTML or PDF. However, the width is not applied to the last node (last column in the report) in a PDF report. This is because, the remaining length of the fixed page width is considered as the actual width of the column.
Alignment: Specifies the alignment of the text.
- Right-click the node and click Properties. Complete the following fields:
- To export a report solution to HTML, follow these steps:
- Right-click the report solution and click Export All to HTML. The Report Export dialog appears.
- Click Browse and select the folder to which you want to export the report.
- Go to the HTML tab and add the title in the Solution Title in HTML field.
- Click OK. The report is generated in the specified folder.
- To export a report to HTML, follow these steps:
- Click the Clear data in data grid icon and clear the result grid.
This is a best practice and helps the application export the report without consuming much of the computer resources.
- Right-click the report and click Export to HTML. The Report Export dialog appears.
- Click Browse and select the folder to which you want to export the report.
- Go to the HTML tab and complete the following fields:
- Select the template for exporting to HTML
Specifies the templates that you want to use with the HTML report. You can use customized templates, provided the formatting is similar to the default templates. The default templates are available in the following folder:
C:\Program Files\erwin\Data Modeler r9\Report\Template\Template-Default
- Solution Title in HTML
Specifies the title for the entire report solution.
- Report Header in HTML
Specifies the text that appears between the report title and the first line of the report.
- Report Footer in HTML
Specifies the text that appears at the bottom of the report.
- Click OK. The report is generated in the specified folder. If the report data spans multiple page grids in the Report Designer, the data is segregated into multiple sections in the HTML. The sections are first divided by model name and then by object name. This means that a section may include objects from different models, which are sorted by model name and object name.
- Click the Clear data in data grid icon and clear the result grid.
- To view the HTML report on a different computer, include the computer name in the path to the filename. For example, if you have published the report to c:\erwin\reports folder on a computer that is named Comp001, use the following path to access it:
\\comp001\erwin\reports\index.htm
Note: The computer from which you are accessing the report must be in the same domain as the one in which the report is published. In addition, the user who is accessing the report must have at least the read-only privileges on the corresponding folder.
- To export a report or a report solution to CSV, follow these steps:
- Right-click the report and click Export to CSV. Or, right-click the report solution and click Export All to CSV. The Report Export dialog appears.
- Click Browse and select the folder to which you want to export the report.
- Go to the TEXT tab and select the following options:
- Format
Specifies whether you want to include the first-level object names multiple times. For example, you have included entity names and attribute names in your report and you have selected No Duplicates. The entity name appears only once for all the corresponding attribute names. If you have selected Duplicates, the entity name appears as many times as the corresponding attribute names appear.
- Text Qualifier
Specifies the symbol that you want to use to indicate the column headers.
- Delimiters
Specifies how you want to separate two columns in the exported report. The option Comma Delimited creates a .CSV file and the remaining options create .TXT files.
- Click OK. The report is generated in the specified folder.
- To export a report to PDF, follow these steps:
- Click the Clear data in data grid icon and clear the result grid.
This is a best practice and helps the application export the report without consuming much of the computer resources.
- Right-click the report and click Export to PDF. The Report Export dialog appears.
- Click Browse and select the folder to which you want to export the report.
- Go to the PDF tab and enter values/set the following fields:
- Solution Title in PDF
Specifies the title for the entire report solution.
- Report Header in PDF
Specifies the text that appears on the first line of every page of the report.
- Report Footer in PDF
Specifies the text that appears at the bottom of every page of the report.
For each of these options, you can specify the font, size, color, and alignment.
- Image Orientation
Specifies the direction of the images that are generated in the report. Images are generated for the Subject Area and ER Diagram reports, when you select properties under Graphical Members.
- Font & Color
Specifies the styles to be used with respect to the font and its color.
- Table of Contents
Indicates whether the report should contain a table of contents.
- Index
Indicates whether the report should contain an index.
- Comprehensive Report
Indicates whether the report should contain comprehensive tabular information based on the items selected for the report. Selecting this option lets you avoid information duplication in the report.
- Go to the Advanced tab and enter values/set the following fields:
- Report Logo
Lets you add a logo to the report. Also, lets you link the logo to a URL of your choice.
- Logo Position
Specifies the position of the logo in the report.
- Alignment
Specifies the alignment of the logo at the selected position in the report.
- Custom Report
Lets you set custom colors to the various sections of the report. Select the Use Custom Colors check box to be able to select colors of your choice.
- Select ER Diagram Format
Specifies the format of the ER diagram.
- Page Size
Specifies the page size that would be used for printing the PDF copy of the report.
- Click OK. The report is generated in the specified folder. If the report data spans multiple page grids in the Report Designer, the data is segregated into multiple sections in the PDF. The sections are first divided by model name and then by object name. This means that a section may include objects from different models, which are sorted by model name and object name.
- Click the Clear data in data grid icon and clear the result grid.
- To add a report from another report solution, follow these steps:
- In the Report Designer dialog, right-click the template name and click Add Report.
- Select the report that you want to include (.erpt file) and click OK.
- Save the report solution.
This section contains the following topics
Pinned Reports from the Report Designer Menu
Change the Logo on the HTML Report
Model Validation Reports
You can now generate model validation reports such as tables that do not have columns and columns that do not have comments. The reports can be generated using filters, and filters are available for the following objects:
- Entity/Table
- Attribute/Column
- Subject Area
- Relationship
- Key group/Index
- Domain
Follow these steps:
- Open erwin Report Designer and create a report.
- Select Logical, Physical, or Logical/Physical. For example, select Logical.
- Select a subject in the Select Report Subject pane. For example, select Entity.
- In the Select Report Fields pane, expand the Filter node for the required object and select the required criterion. For example, expand Entity, Filter, and select No Definition. Expand Properties and select Name.
- Click Run Report.The report opens in erwin Report Designer.
In this example, the report includes the names of entities that do not have a definition.
Pinned Reports from the Report Designer Menu
You can now open the built-in reports from the Open pinned reports from disk toolbar item. The pinned reports are available in the local computer of the user. These reports are segregated into categories and each category of reports is available in a separate folder. You can create a folder of your own add the reports of your choice to it.
The following folder includes the built-in reports:
Windows 7
C:\Users\<user name>\AppData\Local\erwin\Data Modeler\9.8\Report Solutions
Reports that are copied directly under this folder do not appear in the Pinned Reports dialog. The reports must be in a subfolder under this folder.
Follow these steps:
- Launch erwin Report Designer and click Open pinned reports from disk on the toolbar.
The Pinned Reports dialog appears.
- Select the category of the report that you want to see.
- Select one or more reports that you want to run and click OK.
The report is included to the current Report Solution and the Pinned Reports dialog closes.
The Filter By Option
Report Designer includes the Filter By option that lets you generate drill-down reports. Some of the drill-down reports that you can generate are as follows:
Entity/Table level reports
- Entities and tables in the current Subject Area
- Entities and tables that are selected in the current diagram
Attribute/Column level reports
- Migrated attributes and columns
- Owned attributes and columns
- Role-named attributes and columns
- Foreign (FK) Key groups and indexes
- Generated indexes
- Nonunique (IE) Key groups and indexes
- Primary (PK) Key groups and indexes
- Unique (AK) Key groups and indexes
Subject Area reports:
- All entities and tables in the current subject area
- Members of the current diagram
- Members of all the diagrams in the current Subject Area
- Members of all the diagrams in the Main Subject Area, that is, the members of all diagrams at the model level
- Members of the diagrams that are specified at run time
You can use the Graphical Member option for diagrams and can view the images of diagrams.
The filters for Entity/Table and Key Group/Index are available when you select the members of a diagram or a Subject Area.
Attributes and columns can be displayed the following order:
- Alphabetic
- Attribute (the order in which attributes appear on the logical model)
- Column (the order in which columns appear on the physical model)
- Physical (the order in which columns appear in the DDL after Forward Engineering)
- Reverse Alphabetic
|
Copyright © 2019 erwin, Inc.
All rights reserved.
|
|