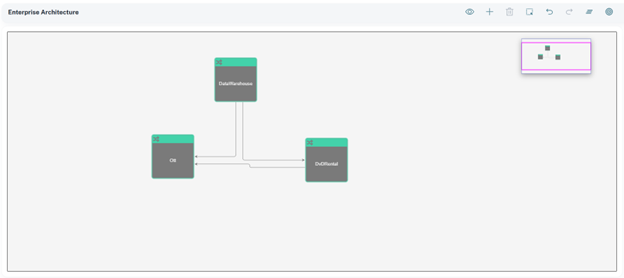
With all your harvested models and metadata, ER360 allows you to construct and visualize Enterprise Architecture (EA) diagrams — helping data modelers, architects, and business users understand the relationships and data flows across systems.
This is particularly useful during modernization, mergers, or platform transitions — for example, when moving from a legacy DVD rental business to an OTT streaming platform.
Example: eMovies Transition to OTT Platform
In this example, we track and visualize the evolution of three key systems:
-
DVD Rental System
Legacy system with tables like CUSTOMERS, MOVIES, and RENTALS.
-
OTT Streaming Platform
Modern system with USERS, CONTENT, and STREAMING_HISTORY.
-
Enterprise Data Warehouse (EDW)
Central integration layer with DW_CUSTOMERS, DW_CONTENT, and DW_USAGE_FACT.
To create and view EA diagrams:
-
Go to the Application Menu > EA
The Enterprise Architecture page opens.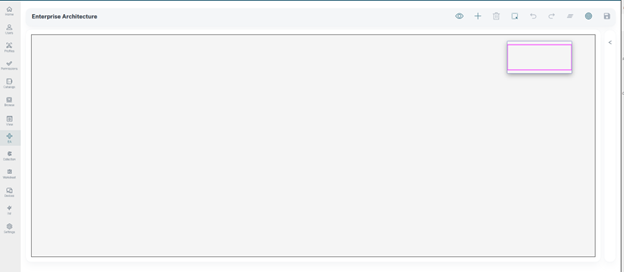
-
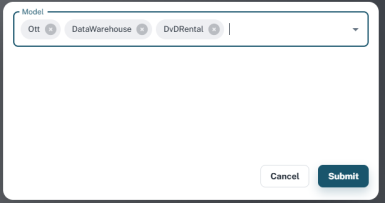
Select the models you want to connect (e.g., DVD, OTT, EDW).
-
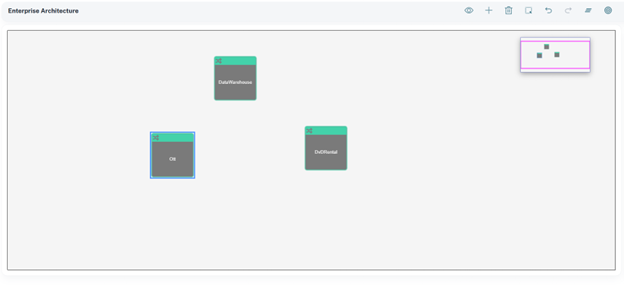
Use drag-and-drop to position models and draw relationships.
-
You can define connections/links such as:
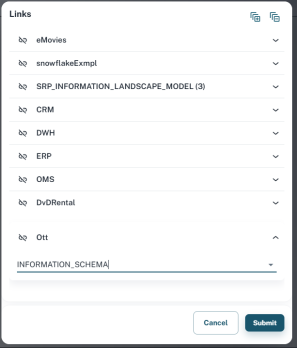
-
DvDRental -> OTT
-
DataWareHouse -> OTT
-
DataWareHouse -> DvDRental
-
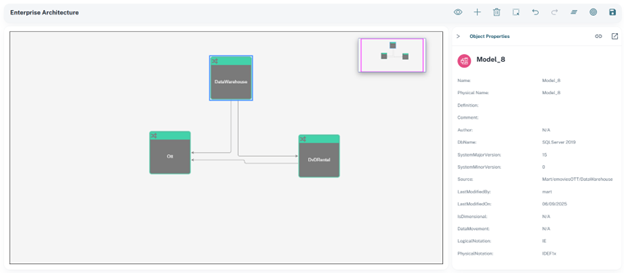
You can also see the Model properties in the right-hand column properties pane: