Viewing Sensitive Data Dashboard
You can select an appropriate Sensitive Data Indicator (SDI) classification for a column while updating column properties. You can also add SDI class as per your requirements in the Metadata Manager Settings. For more information on updating column properties, refer to the Updating Column Properties topic.
The Metadata Manager enables you to view Sensitive Data Dashboard displaying summary and statistics of sensitive columns.
To view sensitive data dashboard, follow these steps:
- Go to Application Menu > Data Catalog > Metadata Manager.
- Under the System Catalogue pane, click Sensitive Data.
- Use System Name and Environment Name to filter the statistics and summary of the sensitive columns.
The Sensitive Data Dashboard page appears and you can also view Summary of Sensitive Columns.
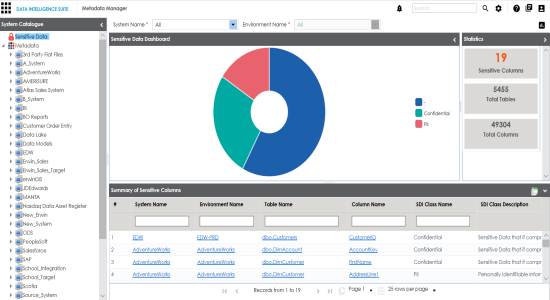
A summary and statistics of sensitive columns of the selected environment are displayed.
|
Copyright © 2020 erwin, Inc.
All rights reserved.
|
|