You can view logs for datasets and views in a catalog during or after data analysis jobs to understand the status and type of the executed job. View logs display the real-time status of data analysis jobs. erwin Data Quality executes multiple automated jobs, such as Pull, Sense, Profile, Curate, Push, and relevant jobs to analyze the data quality and display results.
To view logs for datasets in a catalog, follow these steps:
- Go to Application Menu > Data Quality.
Your erwin Data Quality instance opens. Login to erwin Data Quality (if asked). - On the erwin Data Quality menu, click
 (Admin User),
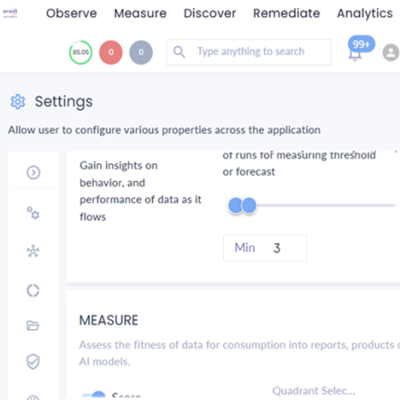
 - Under the admin user icon, click Settings.
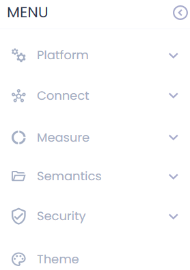
- Click
 to expand menu.
 -
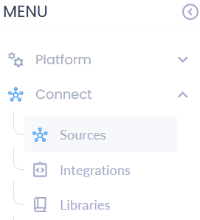
Expand Connect and click Sources.
-
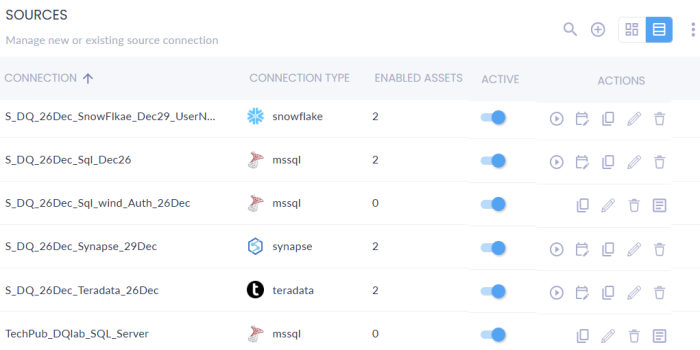
The Sources page appears and displays a list of connections in a list view by default.
-
Click
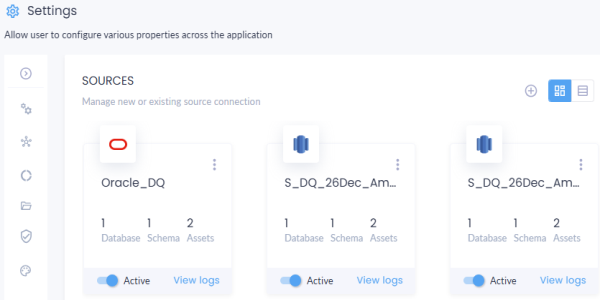
 to switch from list view to grid view.
 -
Click view logs on the required connection card. For example, Oracle_DQ.
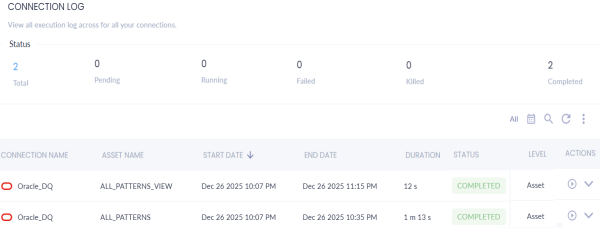
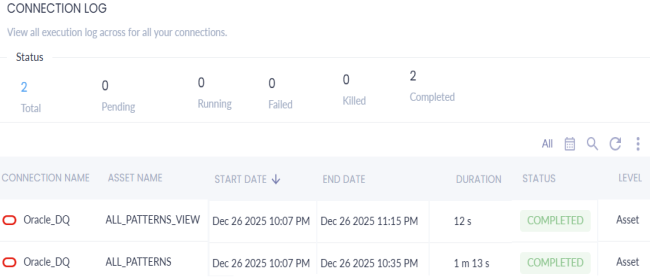
- The connection log page appears. For example, the following image displays connection name, asset names (dataset and view), start date, end date, duration, status, and relevant actions.
The Settings page appears.
The menu expands and displays additional options.
The grid view displays all source connections in a card format.
Alternatively, you can view logs for individual datasets and views. To view logs for an individual dataset, follow these steps:
- Click the required catalog.
- Select the required datasets and views and click
 .
. - Under the Actions column, use the following options:
- Run (
 ): Use this option to re-run a profiling job right away.
 - Expand (
 ): Use this to expand and view profiling stages and status.
- Run (
The catalog configuration page appears and displays the datasets in the catalog.
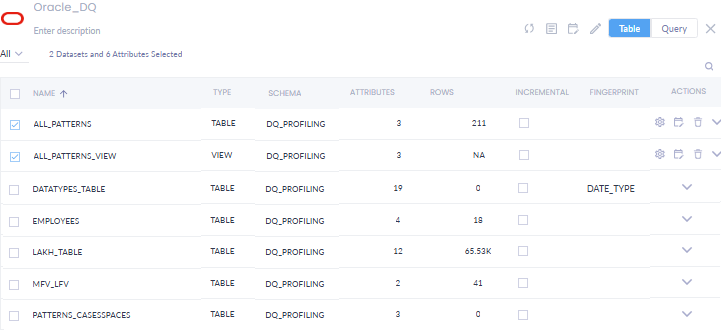
The logs for selected datasets and views appear.