You can run forward and reverse lineage analysis to trace metadata at the table level. Forward lineage analysis generates lineage with the table as source. And, reverse lineage analysis generates lineage with the table as target. The Dual-Combined View lineage analysis generates a lineage, which includes both forward and reverse lineage.
This topic walks you through the following:
Viewing Lineage
To run lineage at the table level, follow these steps:
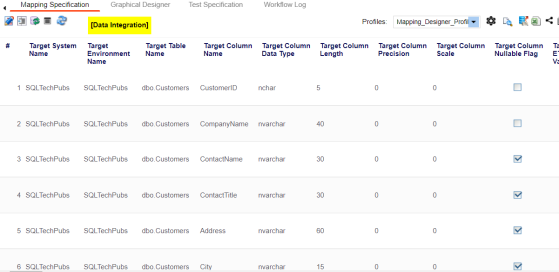
- Go to Application Menu > Data Catalog > Mapping Manager.
- In the Workspace Mappings pane, click the required mapping.
- Select a row.
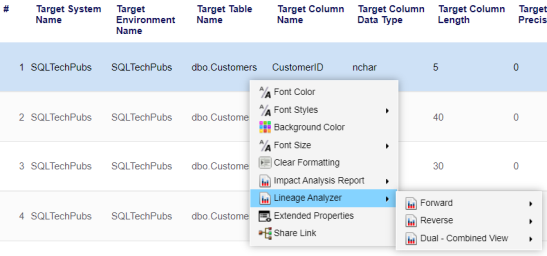
- Right-click a table and hover over Lineage Analyzer.
- Hover over any of the following:
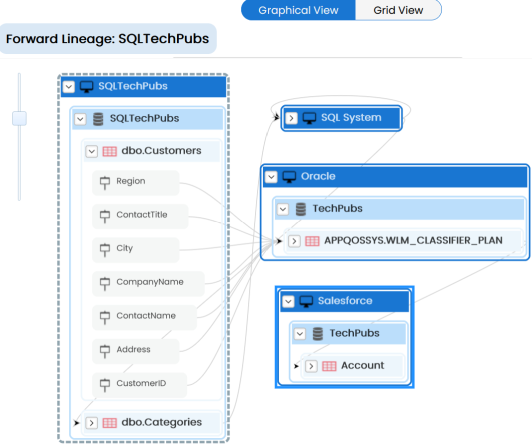
- Forward: Use this option to view forward lineage.
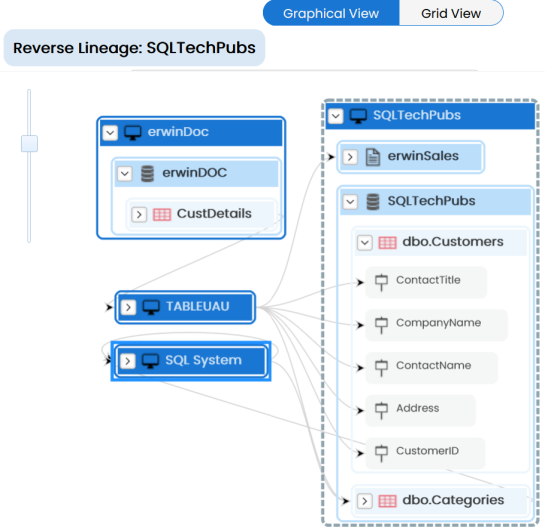
- Reverse: Use this option to view reverse lineage.
- Dual - Combined View: Use this option to view combined forward and reverse lineage.
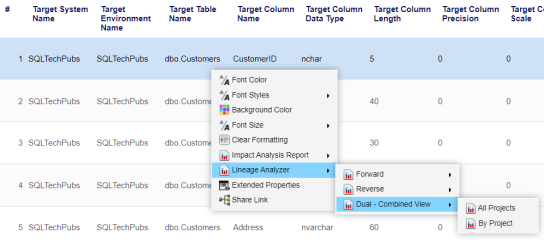
- Use the following options:
- All Projects
- Use this option to include all the projects in lineage analysis.
- By Project
- Use this option to select projects for lineage analysis.
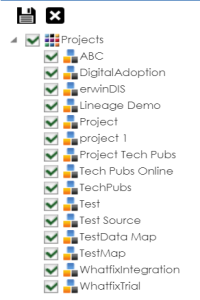
- By default, all projects are selected. Clear the check boxes for the projects that are not required. Then, click
 .
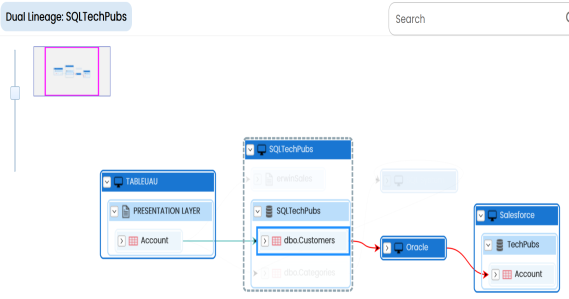
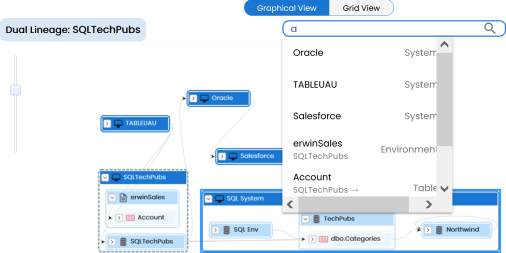
.- The table's dual lineage is generated based on the options you selected. Similarly, you can generate forward, and reverse lineage for tables. By default, the lineage appears in Graphical View.
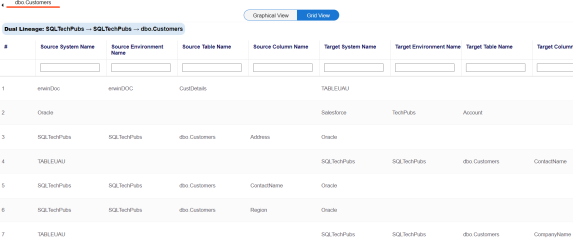
- You can click Graphical View or Grid View to switch between them:
Graphical View: The graphical view displays the lineage of the table in a graphical format. Selecting a table on the graphical view displays its Legends. Hovering over a table displays an
 icon. Clicking this icon opens the object's properties. For more information on updating table properties, refer to the Updating Table Properties topic.
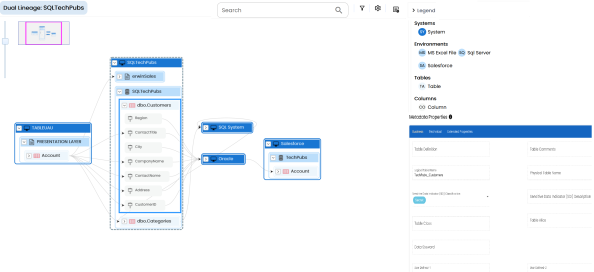
Grid View: The grid view displays the lineage of the table in a tabular format. You can view the source and target system, environment, table, and column associated with the selected table.
- Search (
 )
) -
Use this option to search for tables that you want to see on the lineage.
-
Type in the search box to see a list of related tables that are available on the lineage.
-
- Filter Objects (
 )
) -
Use this option to filter and display required tables in the lineage view.
-
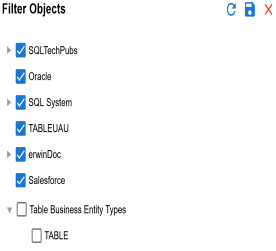
-
The unselected objects are replaced with black dots on the lineage diagram.
-
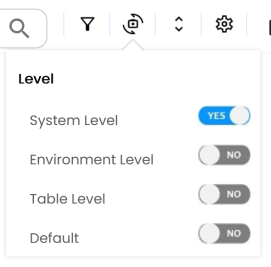
- Switch View (
 )
) -
Double-click an object to see Switch View option. Use this option to switch the level of objects displayed and see the system, environment, or table in which the object is located.
-
- Options (
 )
) -
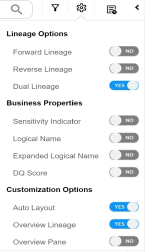
Use this option to view lineage types, business properties and customizations options. For more information on lineage options, refer to the Working on Lineage section.
-
- Export (
 )
) -
Use this option to export the lineage. Click
 and use the following options:
 -
Image (
 ): Use this option to download the lineage as an image, in the .JPG format. Ensure that you expand the required nodes in a lineage before downloading the lineage as image.
 -
PDF (
 ): Use this option to download the lineage report in the .PDF format. Ensure that you expand the required nodes in a lineage before downloading the lineage report as PDF.
 -
Excel (
 ): Use this option to download the lineage report in the .XLSX format. Ensure that you expand the required nodes in a lineage before downloading the report.
The Mapping Specification grid appears.
The options available for Lineage Analyzer appear.
For example, when you hover over Dual - Combined View, All Projects and By Project appear as options.
Use the following options to work on the lineage in graphical view:
On the lineage, expand a table node, and select a column to view its lineage path. The column is highlighted in blue color, its forward lineage path appears in red, and its reverse lineage path appears in blue. The assets that are not part of a lineage path disappear.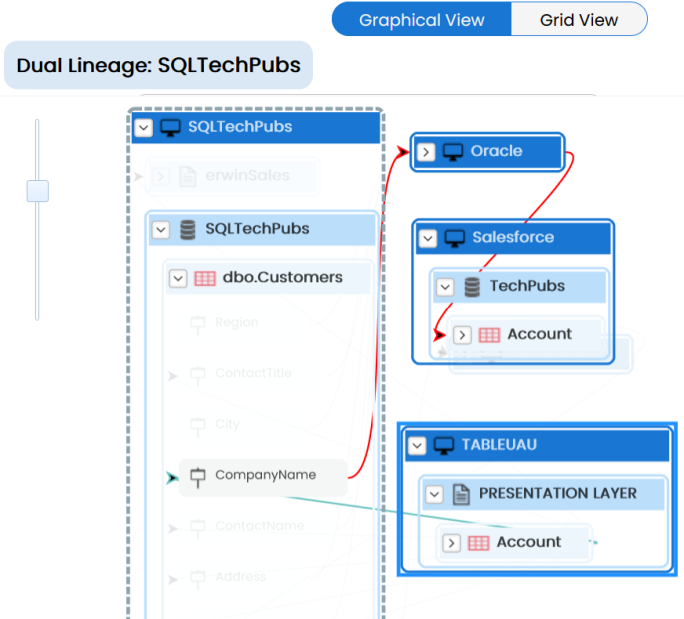
Click a path around the selected object to highlight its path of the source or target in the lineage.
Transformations between columns are indicated using ![]() in the lineage. Hover over
in the lineage. Hover over ![]() to view transformation rules for the columns on a pop-up. Or, click the path between the columns to highlight it to view detailed transformations between them in the Transformation Details pane.
to view transformation rules for the columns on a pop-up. Or, click the path between the columns to highlight it to view detailed transformations between them in the Transformation Details pane.
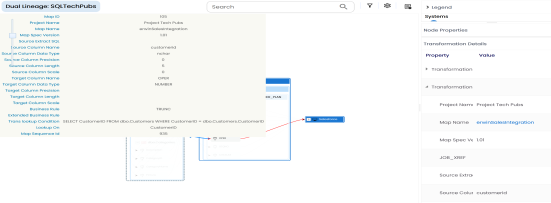
You can expand the transformation node to view the transformation details that includes Business Rule, Extended Business Rule, Trans lookup Condition, Lookup On, and more relevant properties.
Working on Lineage
Lineage of a table shows how metadata moves through tables. It provides a summary of columns used as source and target. Also, it gives you information about the technical and business properties of columns involved in the lineage.
Use the following options to work on lineage:
Use this option to view forward lineage of the table.
Use this option to view reverse lineage of the table.
Use this option to view dual lineage, which includes both forward and reverse lineage of the table.
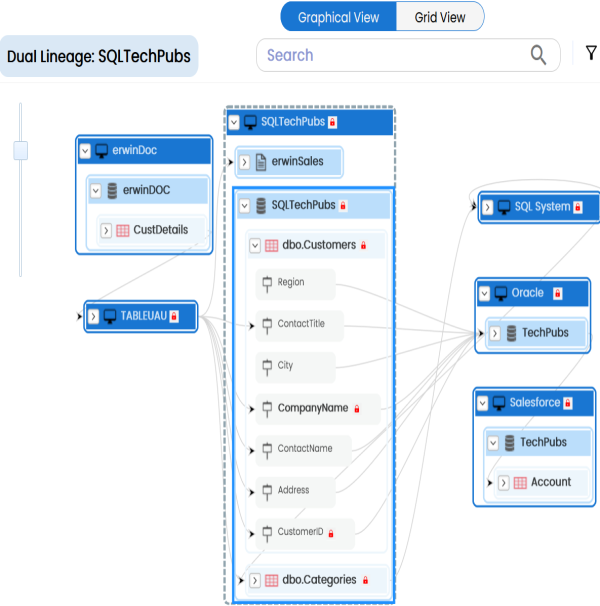
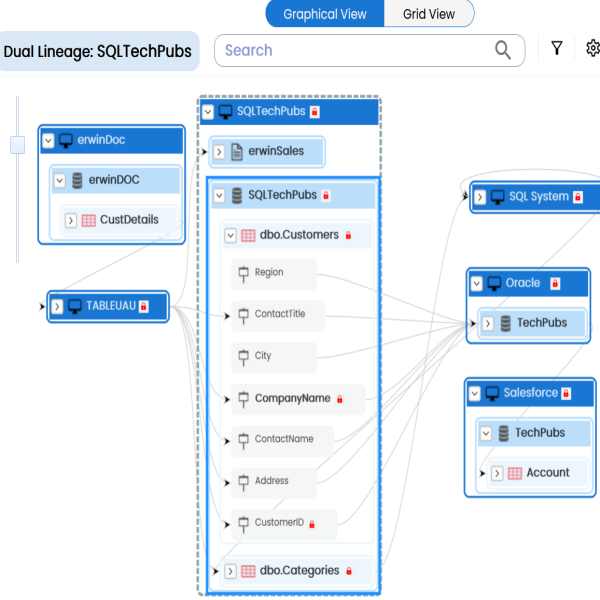
Use this option to view sensitivity of the table in the lineage. You can expand the table node to view sensitive columns. The sensitive assets are indicated using ![]() .
.
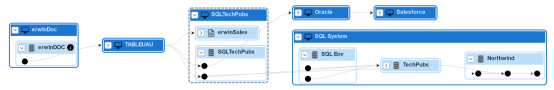
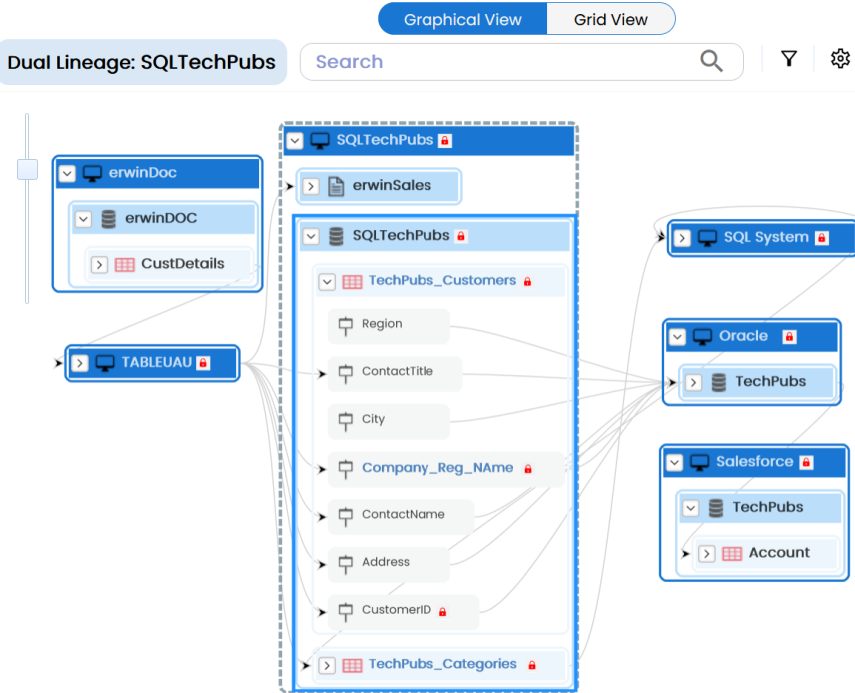
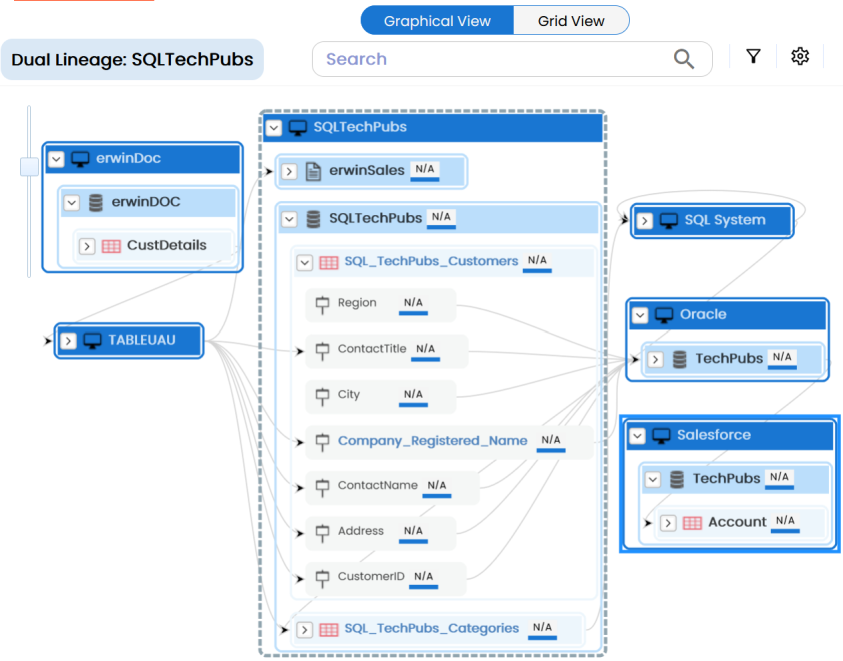
Use this option to view expanded logical names of the tables and columns in an environment in the lineage. You can expand a system node to view environments and tables.
For example, the following image displays the table's logical name in the lineage.
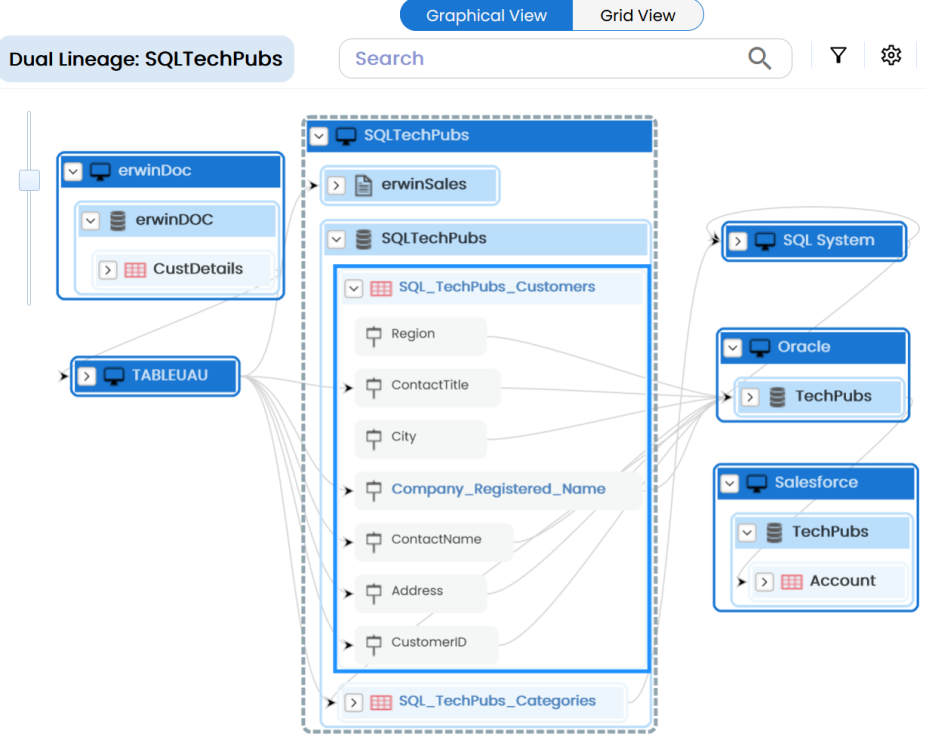
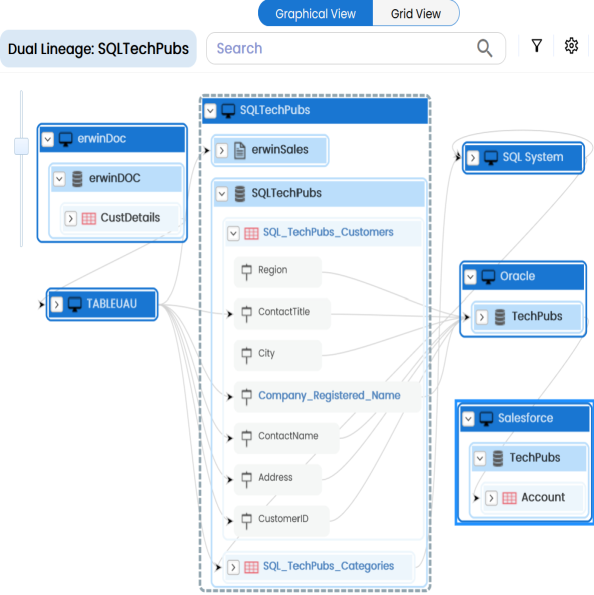
Use this option to view expanded logical names of the tables and columns in an environment in the lineage. You can expand a system node to view environments, tables, and columns. For more information on configuring extended properties of tables, refer to the Configuring Extended Properties topic.
For example, the following image displays the table's expanded logical name in the lineage.
Use this option to view the data quality score of the environments, tables, and columns in the lineage. You can expand a system node to view data quality scores for environments, tables, and columns.
For example, the following image displays the data quality score in the lineage.
Use this option to rearrange the layout of the lineage automatically.
For example, the following image displays the rearranged object layout with respect to the previous screenshot.
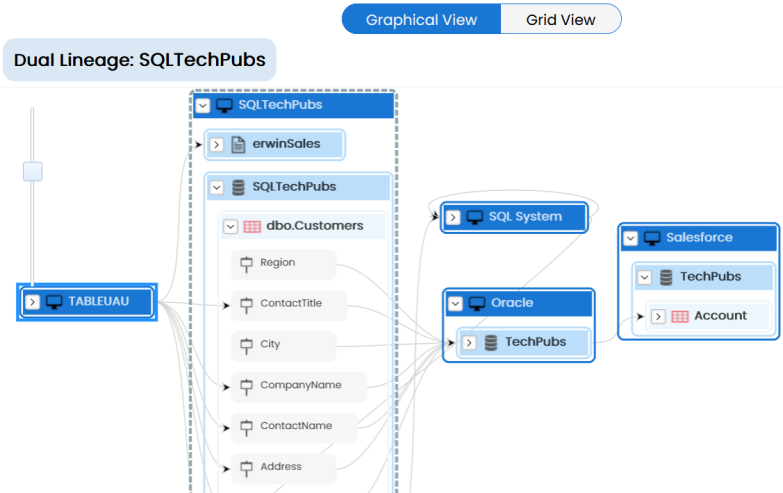
Use this option to view the lineage excluding systems and environments that do not exist in the Metadata Manager. When this option is switched off, the views include systems and environments, that do not exist in the Metadata Manager.
For example, the following image displays lineage excluding assets that do not exist in Metadata Manager.
Use this option to remove the lineage overview pane from the graphical view.