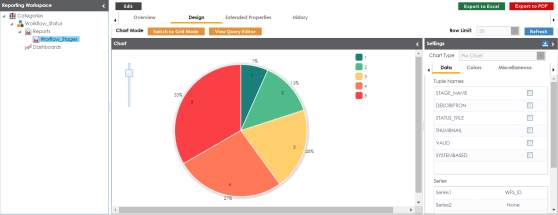
You can create custom reports and classify them under different categories. The reports are generated based on the SQL queries and can be exported to an excel sheet. You can generate reports key metrics from your data integration project and view these reports in a chart and in a grid view.
You can also import reports, and export reports in a .arp format.
To create a new report, you must create a new category. You can create reports under a new or an existing category.
To create a report, follow these steps:
- In the Reporting Workspace pane, expand a category node.
- Right-click the Reports node.
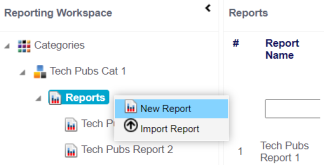
- Click New Report.
- Enter a Report Name and Description.
- Report Name: Workflow_Assignment
- Description: This report is about the workflow assignment to users.
- Use the following options to enable and activate the report:
- Enable
- Switch this option ON to enable the report.
- Activate Report
- Switch this option ON to enable this report.
- You can add only active reports to dashboards.
- Activate Chart
- Switch this option ON to enable the report.
- Click Save and Continue.
- Enter a SQL query based on your requirements and use Ctrl + Space to get the list of tables.
- Click Validate Query.
- Click Save.
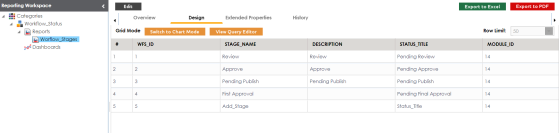
The following page appears.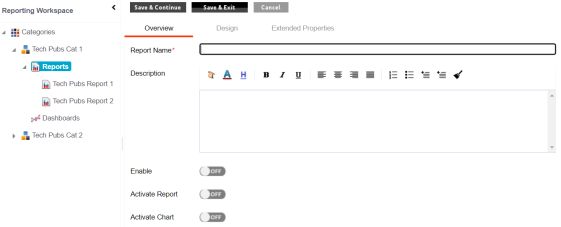
For example:
The report is created and saved in the Reports tree.
By default, the Design tab appears.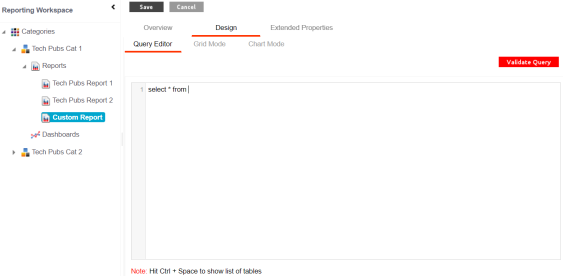
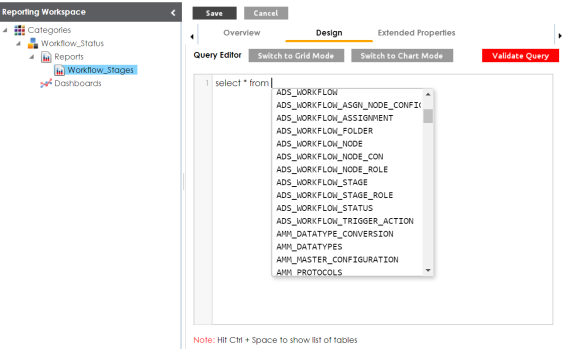
The query is validated.
After you create a report, use the following options on the Design tab:
You can also import and export reports from a category. For more information, on exporting and importing reports, refer to the Exporting and Importing Reports topic.
You can also manage the custom reports. Managing reports involves:
- Editing reports
- Copying reports
- Exporting reports
- Deleting reports
|
Copyright © 2026 Quest Software Inc. |