Viewing Execution Logs
You can view execution logs for datasets in a catalog during or after data analysis jobs to understand the status and type of the executed job. Execution logs display the real-time status of data analysis jobs. DQLabs executes multiple automated jobs, such as Pull, Sense, Profile, Curate, Push, and relevant jobs to analyze the data quality and display results.
To view execution logs for datasets in a catalog, follow these steps:
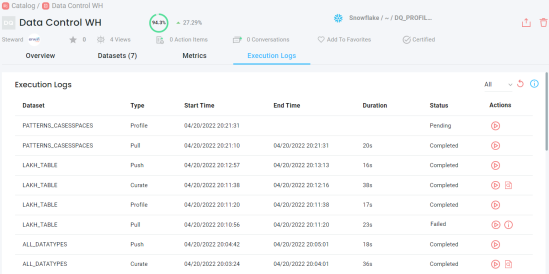
- On the catalog overview page, go to Execution Logs.
Execution logs for the catalog appear in a tabular format. This page displays dataset names, type of job, time duration, status, and relevant actions for each job type.
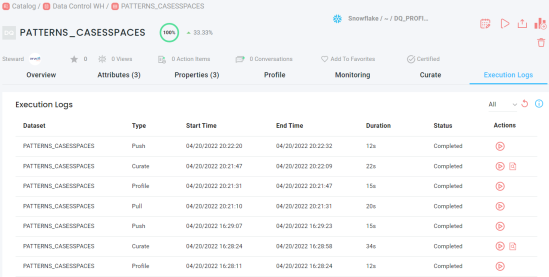
Alternatively, you can view execution logs for individual dataset.
To view execution log for an individual dataset, go to the Dataset tab and select a dataset. Then, go to the Execution Log tab. Execution logs for the selected dataset appear.
- Under the Actions column, use the following options:
- Run (
 ): Use this option to re-run a job type right away.
 - Data Preview (
 ): Use this option preview attributes and their properties. This option is available only when the executed job type is Curate.
 - View Error Log (
 ): Use this option to view the error log for failed jobs.
- Run (
On the Execution Logs page, you can use the following options:
- Reload (
 ): Use this option to refresh execution logs after or during a job.
 - Job Status (
 ): Use this option to view the job status based on the job type.
|
Copyright © 2024 Quest Software Inc. |