Viewing Metadata Manager Dashboard
The Metadata Manager Dashboard displays metrics that help you analyze and track your metadata. It presents this information using charts and graphs.
To access Metadata Manager Dashboard, follow these steps:
- Go to Application Menu > Data Catalog > Metadata Manager > Explore.
- Click the Metadata Manager Dashboard pane.
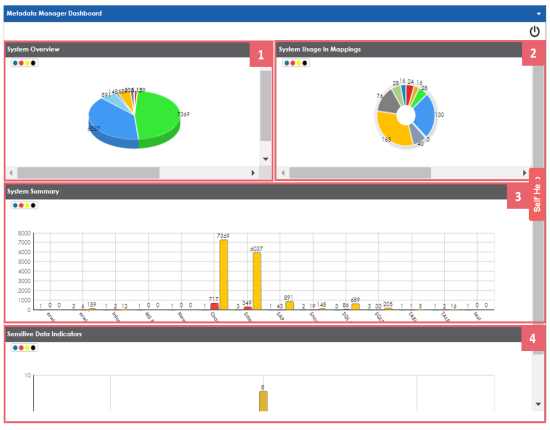
The Metadata Manager Dashboard pane appears.
|
UI Section |
Function |
|---|---|
|
It displays number of columns in each system. |
|
|
It displays usage of each system in mappings. |
|
|
It displays number of environments, tables, and columns in each system. |
|
|
It displays number of sensitive columns in each system. |
System Overview
The System Overview pane displays the number of columns in each system in a pie chart. To open the chart in the Dashboard View, click the pie chart.
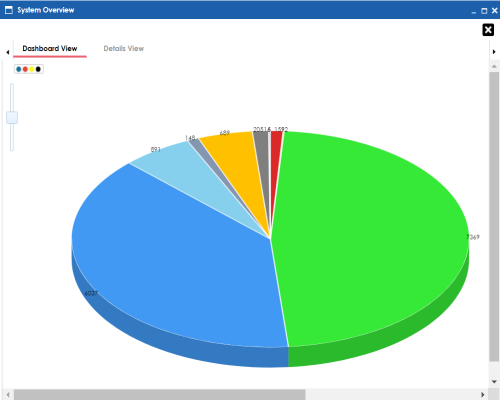
Each slice of the pie chart corresponds to a system. You can drill down and view detailed information in the list format.
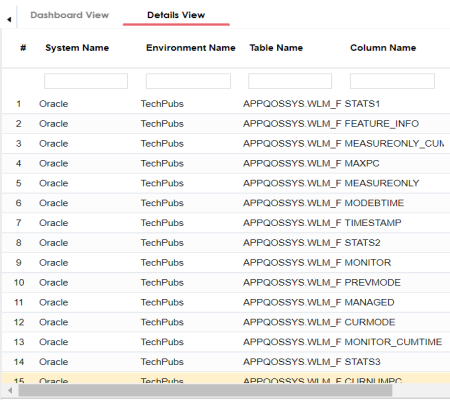
To view detailed information about a system, click a slice. The Details View tab opens. It includes system name, enviro-nment name, table name, and column name.
System Usage in Mappings
The System Usage in Mappings pane displays the number of instances each system is used in mappings in a pie chart. To open the chart in Dashboard View, click the pie chart.
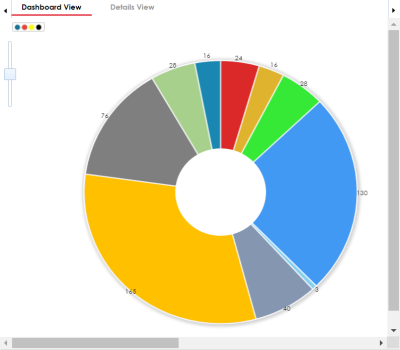
Each slice of the pie chart corresponds to a system. You can drill down and view detailed information in the list format.
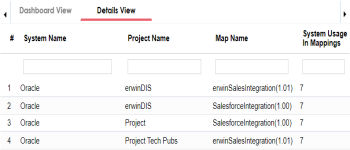
To view detailed information about a system, click a slice. The Details View tab opens. It displays system name, project name, map name, and system usage in mappings.
System Summary
The System Summary pane displays the number of environments, tables, and columns in each system in a bar graph. To open the bar graph in the Dashboard View, click the bar graph.
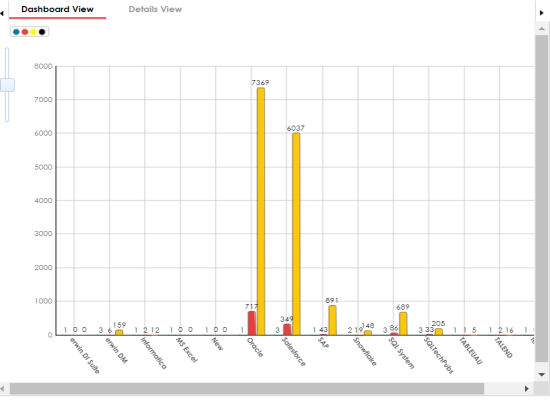
Each set of three bars corresponds to a system and represents the number of environments, tables, and columns in the system. You can drill down and view detailed information in the list format.
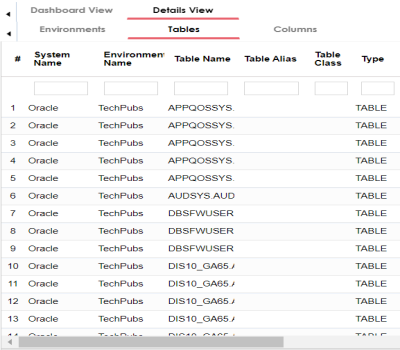
To view the detailed information, click a bar.
For example, if you click a table bar, then the Tables tab opens.
Sensitive Data Indicators
The Sensitive Data Indicators pane displays the number of sensitive columns in each system in a bar graph. To open the bar graph in the Dashboard View, click the bar graph.
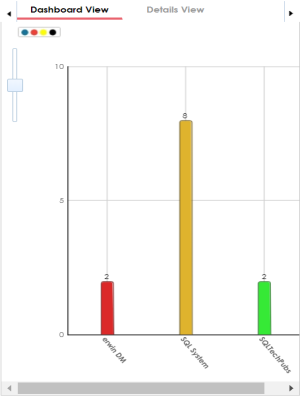
Each bar of the bar graph corresponds to a system. You can drill down and view detailed information in the list format.
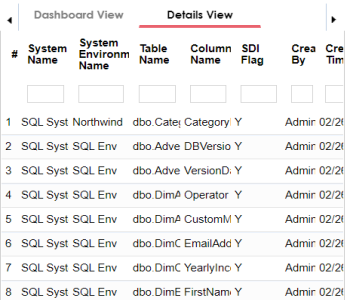
To view detailed information about sensitive columns in a system, click a bar. The Details View tab opens. It displays system name, environment name, table name, column name, and SDI flag.
|
Copyright © 2023 Quest Software Inc. |