To access the Metadata Manager, go to Application Menu > Data Catalog > Metadata Manager.
Based on your configuration, either the Dashboard tab or the Explore tab opens. To configure the landing tab,
click ![]() on the top-right corner to set either of the following tabs as default:
on the top-right corner to set either of the following tabs as default:
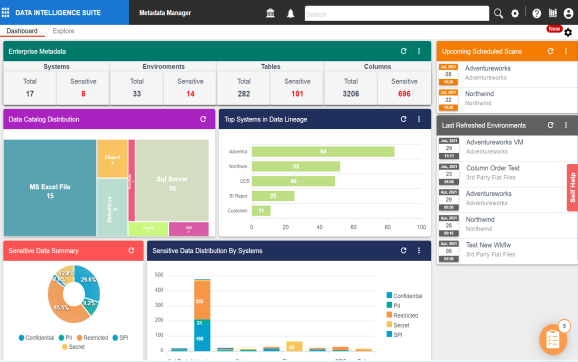
The Dashboard tab displays a snapshot of the underlying data in the Metadata Manager. This includes information about technical assets, their sensitivity, associations, and usage in mappings. For more information about the Dashboard tab, refer to the Viewing Metadata Manager Dashboard topic.
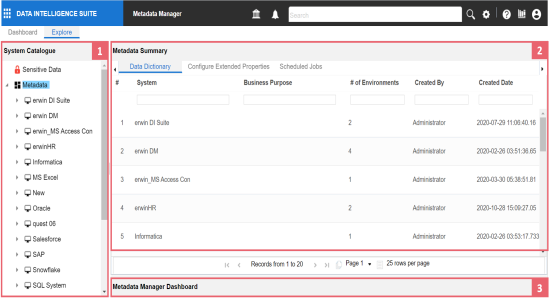
The Explore tab is the primary work area. It displays the scanned or imported metadata in a hierarchy and lets you manage metadata. On the Explore tab, you can scan metadata from data sources, associate technical assets with other assets, view mind maps, analyze data lineage, and so on.
|
UI Section |
Function |
|---|---|
|
1-System Catalogue |
Use this pane to browse through your metadata that is stored in a hierarchical manner, System > Environment > Table > Column. |
|
2-Right Pane |
Use this pane to view or work on the data based on your selection in the System Catalogue. |
|
3-Metadata Manager Dashboard |
Use this pane to view consolidated reports on system overview, system usage in mappings, system summary, and sensitive data indicators. |
Managing metadata involves the following:
- Creating and managing systems
- Creating and managing environments
- Scanning metadata from data sources
- Creating new versions of environments
- Downloading and updating data dictionary
- Running impact analysis
- Running lineage analysis
- Previewing and profiling data
- Configuring extended properties
- Creating and managing test cases for tables
- Viewing metadata manager dashboard
- Viewing access rights and data governance reports
|
|
|
Copyright © 2021 erwin, Inc. All rights reserved. Copyright © 2021 Quest Software Inc. All rights reserved. All trademarks, trade names, service marks, and logos referenced herein belong to their respective companies. |