Mind Maps
A mind map is a pictorial representation of associated assets. You can view sensitivity of assets, logical and expanded logical name of tables and columns, and relationships between the assets. It is also possible to use filter to view more focused mind map based on asset types and relationships.
To view mind map of business assets, in the <Business_Asset> grid, click ![]() .
.
Use the following options to work on the mind map:
 )
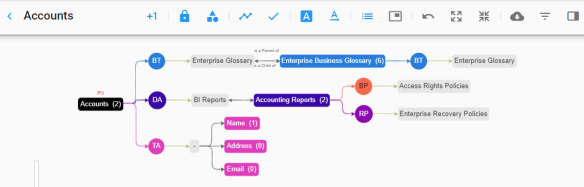
)Switch View Counts to to view number of associations. For example, the following mind map displays the number of associations of the Accounts business term as two.
Switch View Sensitivity Data Indicator to ![]() to view sensitive data indicator of assets on the mind map.
to view sensitive data indicator of assets on the mind map.
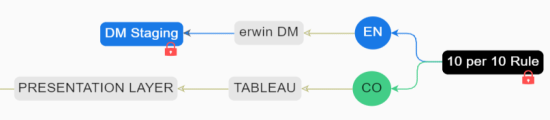
For example, the following mind map displays the sensitivity data indicator as sensitive (![]() ) for the 10 per 10 Rule business term.
) for the 10 per 10 Rule business term.
Switch View Sensitivity Data Classification to ![]() to view sensitivity data classification of assets on the mind map.
to view sensitivity data classification of assets on the mind map.
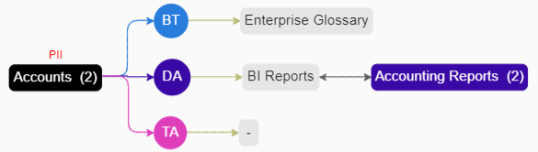
For example, the following mind map displays sensitivity data classifications of assets as PII (Personally Identifiable Information).

![]() to view enterprise relationship configuration. The enterprise relationship configuration refer to the line color and type as configured in the Business Glossary Manager.
to view enterprise relationship configuration. The enterprise relationship configuration refer to the line color and type as configured in the Business Glossary Manager.
For example, the following mind map displays the relationship between business term and column in blue color and Zig Zag type display.
Switch Include Relationships to ![]() to view relationships between assets on the mind map.
to view relationships between assets on the mind map.
For example, the following mind map displays the relationships between an environment and business term (is associated with).

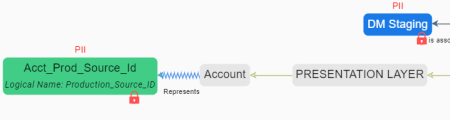
Switch Logical Names to ![]() to view logical names of associated tables and columns on the mind map.
to view logical names of associated tables and columns on the mind map.
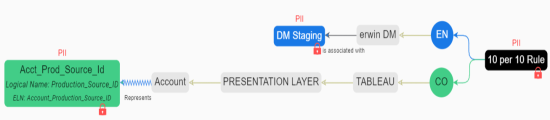
For example, the following mind map displays a column's logical name.
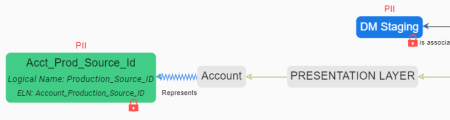
Switch Expanded Object Logical Names to ![]() to view expanded logical names of associated tables and columns on the mind map.
to view expanded logical names of associated tables and columns on the mind map.
For example, the following mind map displays a column's expanded logical name.
Switch Legend to ![]() to view legend of the mind map.
to view legend of the mind map.
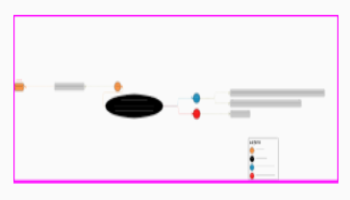
Switch Overview to ![]() to view the overview of the mind map. You can slide the purple box to navigate across the mind map.
to view the overview of the mind map. You can slide the purple box to navigate across the mind map.
Use this option to expand the nodes of the assets on the mind map.
Use this option to collapse the nodes of the assets on the mind map.
Use this option to download the mind map in the XLSX or JPG format.
Use this option to filter the mind map based on:
- Asset Type: You can exclude or include asset types from the mind map.
- Relationships: You can exclude or include assets based on relationships from the mind map.
Click an asset on mind map to view its properties with association statistics under this pane. The properties of a technical asset differs from that of a business asset.
|
|
|
Copyright © 2021 erwin, Inc. All rights reserved. Copyright © 2021 Quest Software Inc. All rights reserved. All trademarks, trade names, service marks, and logos referenced herein belong to their respective companies. |