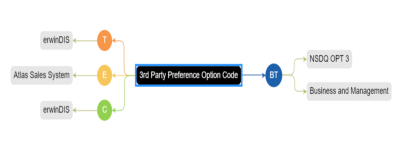
A mind map displays the pictorial representation of a business asset and its association with other assets. On a mind map, associated technical assets appear on the left side and associated business assets appear on the right side of the business asset. You can select an asset on a mind map and view its properties, association statistics, and sensitivity under the Object Properties pane.
To view mind maps, follow these steps.
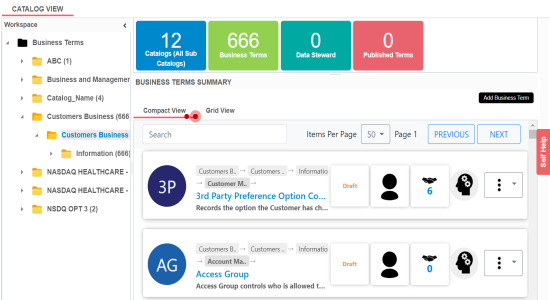
- In the browser pane, click <Business_Asset_Name>.
- In the Workspace pane, click the required catalog.
- Under <Business_Asset> Summary, click
 for the required business asset.
 - Use the following options to work on the mind map:
- Expand Asset Level
- Use this option to expand the mind map at asset level. Hover on a node and click the plus (+) icon or right-click a node, and then click Expand Asset Level.
- Reload Mind Map Diagram (
 )
)- Use this option to reload the mind map.
- Expand All
- Use this option to expand the mind map to view the associated technical and business assets.
- Collapse All
- Use this option to collapse the expanded nodes and restore the mind map to its original form.
- Export
- Hover over Export and use the following options:
- Mind Map - Excel Report: Use this option to download the mind map report in the .xlsx format. Ensure that you expand the mind map before downloading the report.
- Sensitivity Details - Excel Report: Use this option to download the sensitivity report of all associated assets in the .xlsx format. This report includes sensitive data indicator (SDI), SDI classification, and SDI description of the associated assets.
- Mind Map - Image: Use this option to download the mind map as an image, in .jpg format. Ensure that you expand the mind map before downloading the mind map image.
- Asset Hierarchy Background
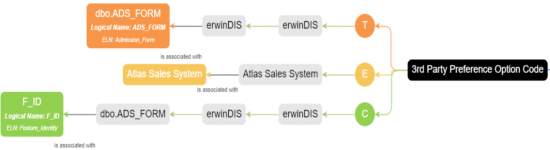
- Select the Gray Background check box to display gray colored background for the asset hierarchy nodes. For example, the following mind map displays nodes in the hierarchy with a gray-colored background.
- Relationship Options
- Use the following options to configure relationship options:
- Include Relationships: Use this option to display relationships between the assets on the mind map.
- Switch to Enterprise Relationship configuration: Use this option to apply the selected line color and type configured in the Business Glossary Manager Settings.
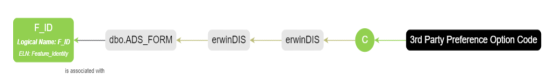
For example, in the following mind map, the relationship (is associated with) and the line color as set in Business Glossary Manager Settings appear on the mind map.
- View Logical Names
- Use the following options to view logical and expanded logical names of tables and columns on the mind map:
- Logical Names: Use this option to view logical names of tables and columns on the mind map.
- Expanded Logical Names: Use this option to view expanded logical names of tables and columns on the mind map.
You can configure logical names and expanded logical names of tables and columns in the Metadata Manager.
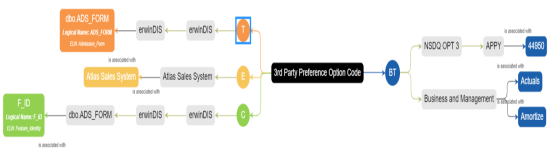
For example, the following mind map displays logical names and expanded logical names.
- View Sensitivity
- Use the following options to view sensitivity details of the assets on the mind map:
- Sensitivity Data Indicator(Y/N): Use this option to view the sensitive assets on the mind map.
- Sensitive Data Classification: Use this option to view the sensitive data classification of the assets on the mind map.
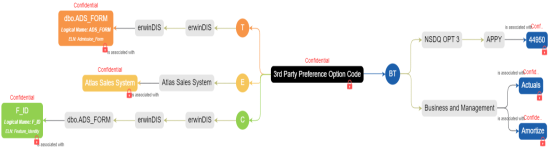
For example, the following mind map displays the sensitive data indicator as sensitive (
 ) and sensitive data classification as Confidential.
For more information on updating sensitivity of assets in a mind map, refer to the Updating Sensitivity topic.
- Filter
- To filter the components of mind map, expand the Filter pane and use the following options:
- By Asset Type: Use this option to filter in the required asset types in the mind map
- By Relationship: Use this option to filter in the required assets in the mind map based on relationship.
For example, if you select only Column for By Asset Type and is associated with for By Relationship, then only associated columns with is associated with relationship are shown in the mind map.
-
The Workspace switches to the business asset view. For example, if you click Business Terms in the browser pane, the Workspace switches to the Business Terms view.
The Mind Map page appears.
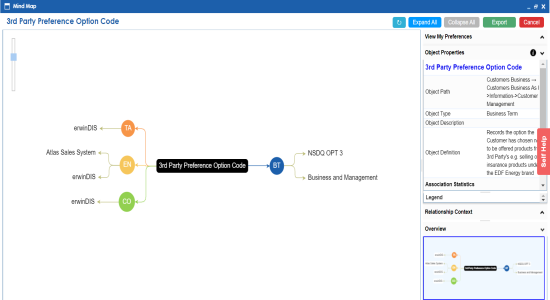
View My Preferences
You can set your preferences to view the mind map according to your requirements. Expand the View My Preferences pane and use the following options:
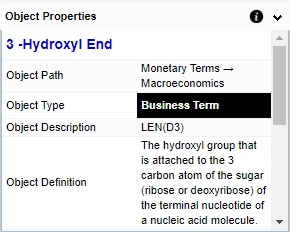
Object Properties
Click an asset on mind map and view its properties with association statistics and sensitivity. Asset properties differ for technical and business assets.
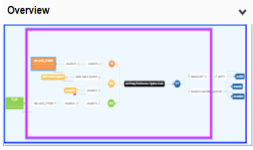
Overview
Expand this pane to open a pan view of the mind map. You can slide the purple box to navigate across the mind map.
|
Copyright © 2020 erwin, Inc.
All rights reserved.
|
|